Chart Data
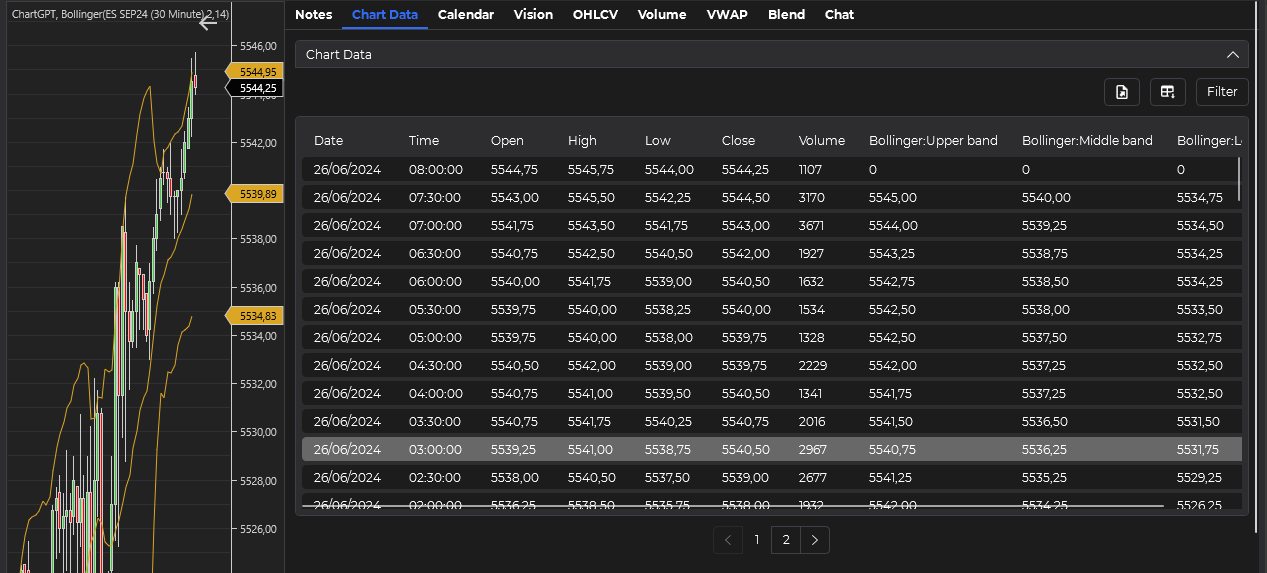
The Chart Data tab is a powerful feature in ChartGPT that allows you to analyze and interact with your chart data using advanced AI capabilities. This tab provides a comprehensive view of your chart data and enables you to leverage Large Language Models (LLMs) for in-depth analysis.
Key Features
Data Display and Management
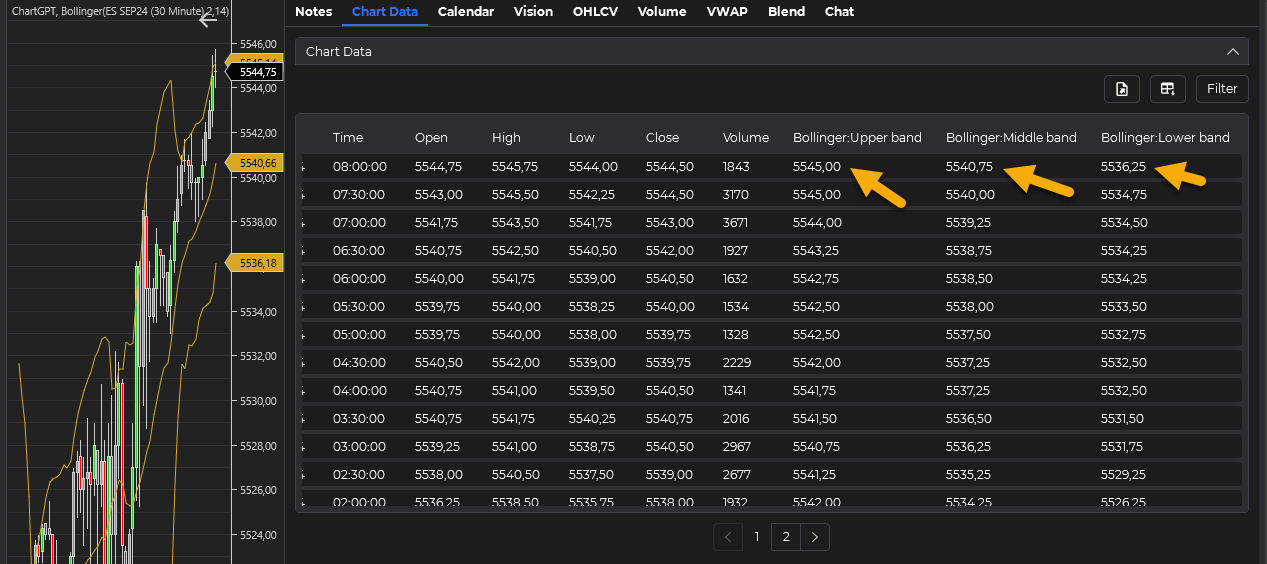
- Indicator Integration: Any indicators added to your chart will automatically appear in the data view.
- Column Organization: Customize and save your preferred layout of data columns for easy viewing.
- Pagination: Navigate through large datasets efficiently with built-in pagination.
Data Manipulation
-
Filtering: Apply filters to your data to focus on specific time periods or data points.
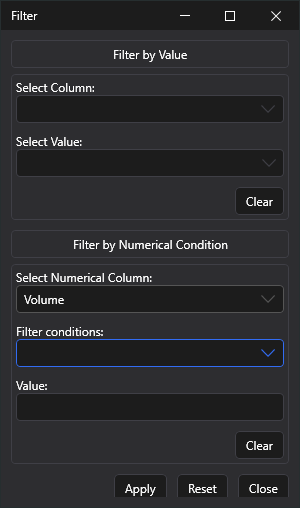
-
CSV Export: Export your data as a CSV file for further analysis.
💡CSV Export is available for Personal and Pro tier subscribers. For more information on pricing and features, please visit our Pricing Page.
AI-Powered Analysis and Response Handling
The Chart Data tab integrates powerful AI capabilities for data analysis and provides intuitive response handling features. For detailed information on how to use these features, please refer to our dedicated pages:
- Prompt Area: Learn how to write effective prompts, select AI models, and initiate analysis.
- Response Area: Discover how to interpret AI responses, use text-to-speech features, search past analyses, and save useful prompts.
These sections are consistent across most tabs in ChartGPT, providing a unified experience for AI-powered analysis throughout the application.
Important Configuration Note
To ensure that the Chart Data tab displays the most recent data, including the last bar, it's crucial to configure your indicators correctly:
Go to the indicator's properties
Navigate to the properties section of your chosen indicator.
Locate the "Calculate" option
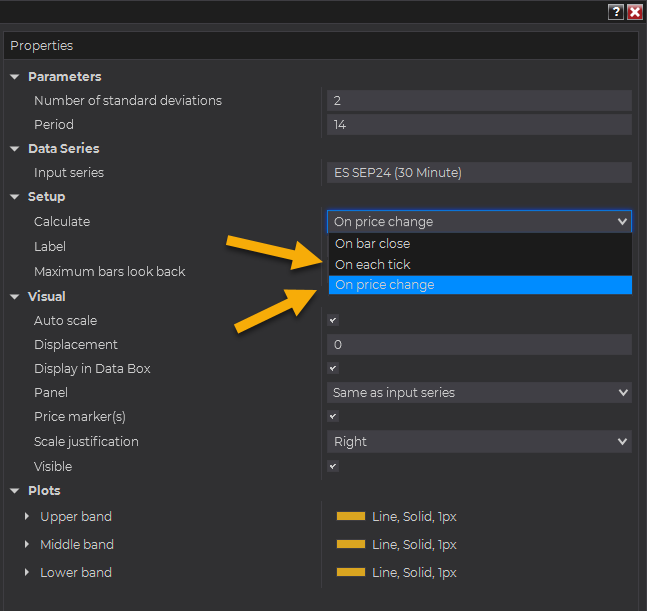
In the "Setup" section, find the "Calculate" option.
Set the update frequency
Set this option to either "On Price Change" or "On Each Tick".
This configuration allows the data grid to update more frequently, providing you with the most current information.
Be aware that updating more frequently than "On Bar Close" may impact performance, especially for computationally intensive indicators or when dealing with high-frequency data. If you experience slowdowns, consider adjusting less critical indicators to update "On Bar Close".
Please note that all values displayed in the Chart Data tab are rounded to the instrument's ticksize, following NinjaTrader's default method. This ensures consistency with the platform's standard display of price data.
Usage Tips
- Indicator Optimization: Add relevant indicators to your chart before analyzing to provide the AI with more context.
- Structured Prompts: Create clear, specific prompts for more accurate and useful AI responses.
- Regular Exports: Periodically export your data to keep a record of your analysis over time.
- Combine with Other Tabs: Use insights from the Chart Data tab in conjunction with other tabs for comprehensive analysis.
AI Integration
The Chart Data tab's integration with AI models allows for:
- Pattern recognition in price movements
- Correlation analysis between different data points
- Predictive modeling based on historical data
- Anomaly detection in trading volumes or price action
Future Enhancements
We are continuously working to improve the Chart Data tab. Upcoming features may include:
- More advanced filtering options
- Integration with additional data sources
- Enhanced AI models for more sophisticated analysis
The Chart Data tab is designed to be a powerful tool for traders who want to leverage AI for deeper insights into their trading data. By combining traditional chart analysis with cutting-edge AI technology, ChartGPT provides a unique advantage in understanding market dynamics.